Record details for support
Last updated: July 18, 2026
Summary
In case of a technical issue that you are experiencing, the support team might ask you or your users to provide some additional technical information to help troubleshooting. The steps in this article can then be followed.
Thank you for reporting unexpected behaviour by Portflow. Occasionally, the error message is not providing enough relevant information to help solve your issue. In this article, we will explain the steps of recording your browser's inspection window. Depending on the context and type of issue, we would ask you to record your browser's network response or launch details.
Record Network Response
Recording your network response will provide us more information which can help us help you.
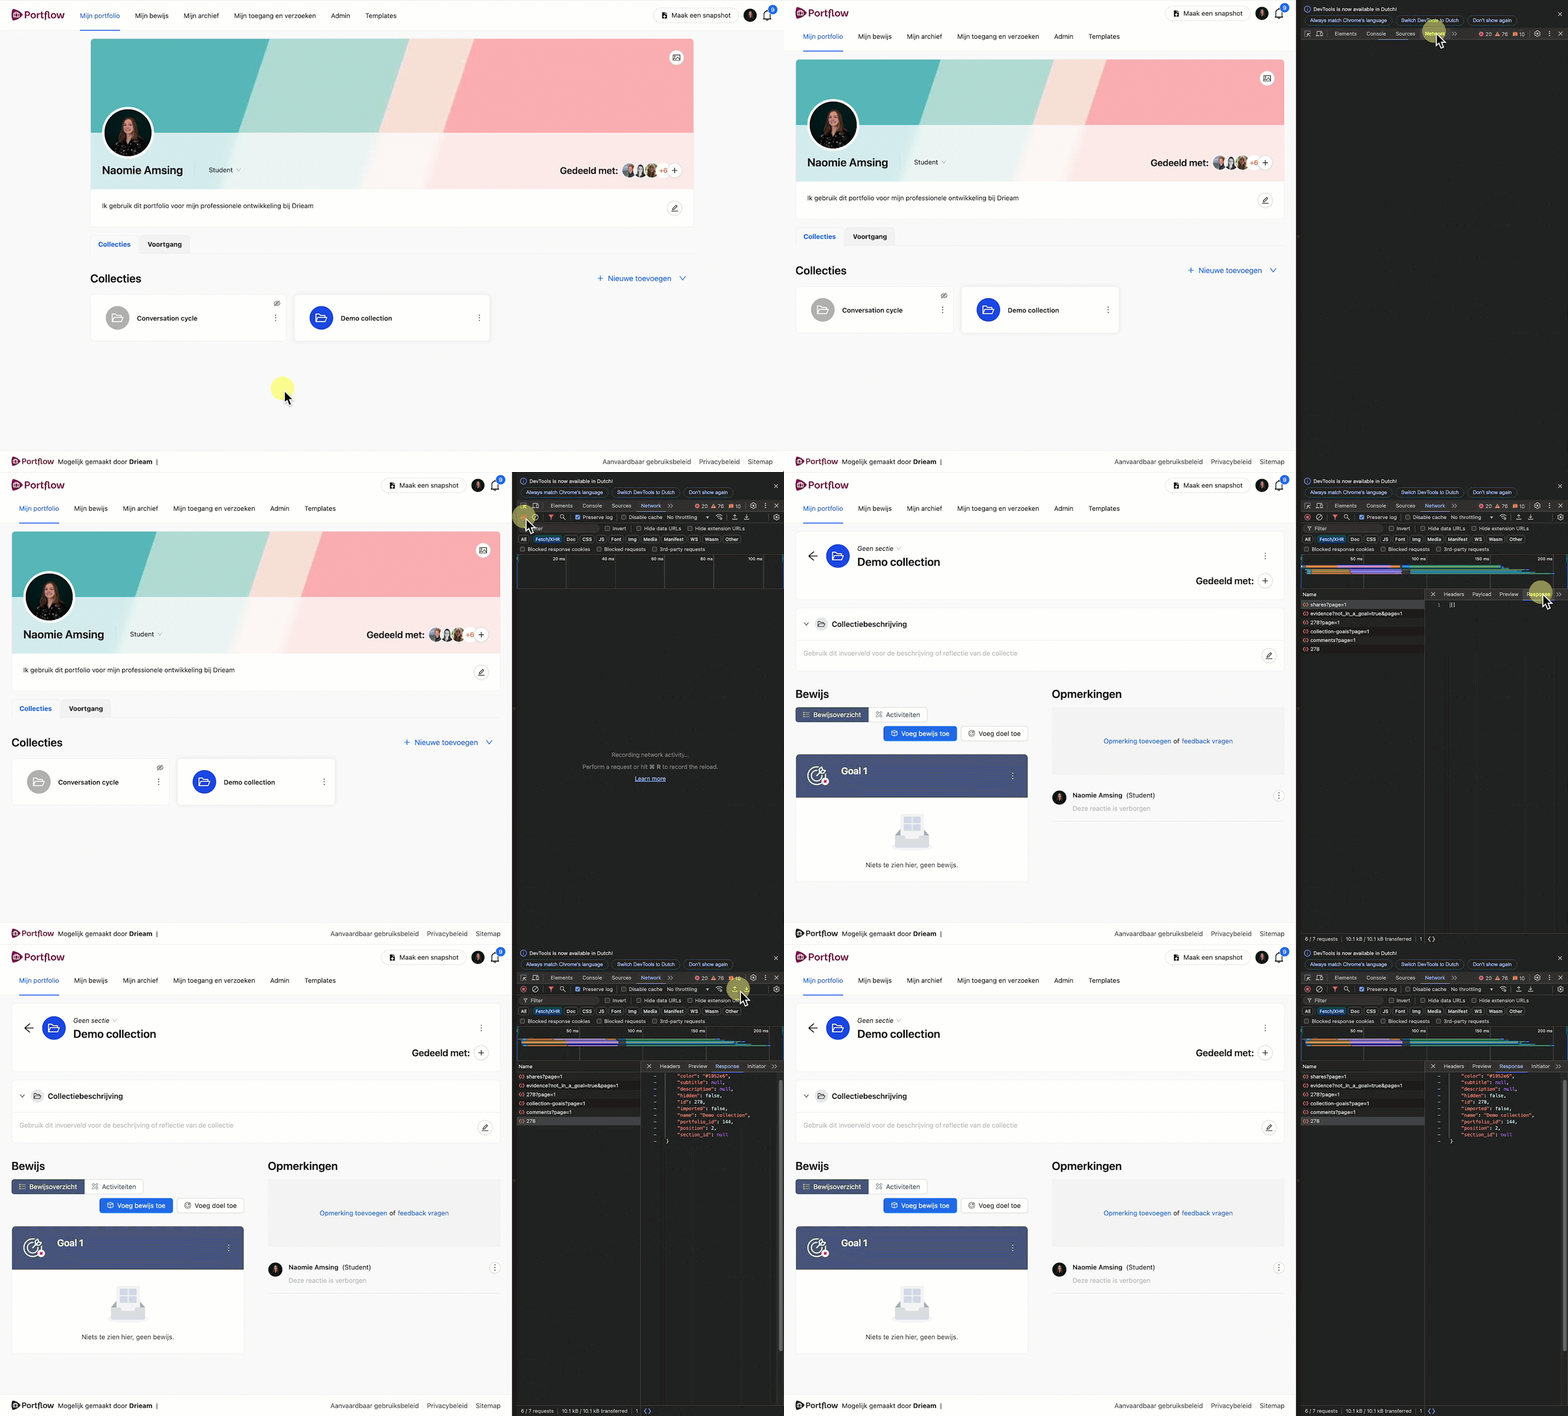
'Inspect' your browser page
Right click anywhere on the page and click InspectSelect the 'network' tab
At the top there are several tabs: Elements, Console, Sources, NetworkClick 'clear network log' and then 'start recording'. Filter on 'fetch/XHR'
Click the 'clear' icon to clear the log. If the red recording icon is not on yet, select it. Turn on the filter to hide irrelevant information.Start a screen recording
Instructions from Windows and Mac. Make sure to include the 'inspect' drawer in the video.Retrace your steps which caused the error message. Keep the 'inspect' drawer open!
Do what you did when you received the error. If any row displays in RED, click on it, and open the 'response' tab, to show us a more detailed description of the error.Stop your screen recording
When you have finished the demonstration, end and save the video recording file.Download the network response file
Click the download icon to save the .har fileSend the video recording and .har file in a ticket to the support agent.
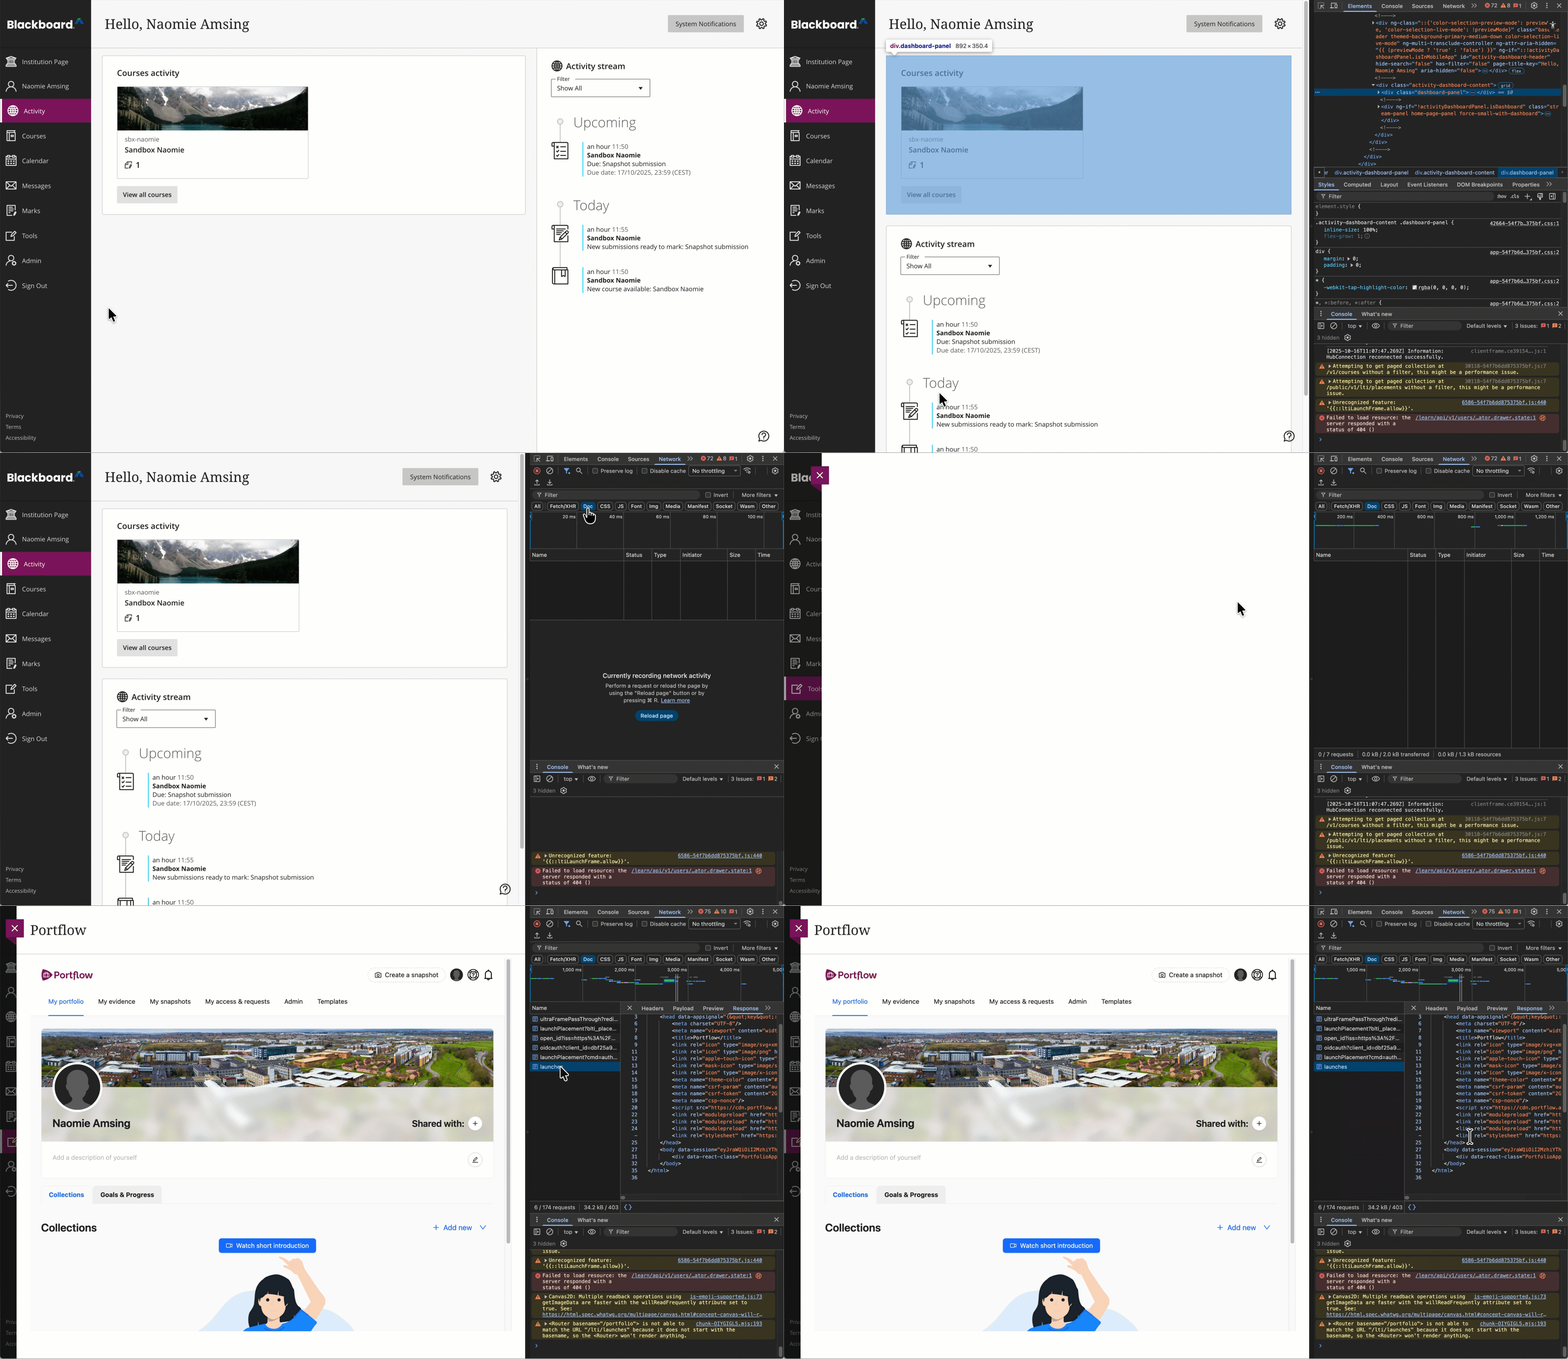
Record launch details
Recording your launch details are helpful to solve issues where the launch of Portflow is showing unexpected behaviour.
'Inspect' your browser page
Right click anywhere on the page and click InspectSelect the 'network' tab, and filter on ‘Doc’
At the top there are several tabs: Elements, Console, Sources, NetworkCopy the response as cURL
Find ‘launches’ in the row of items
Right-click on launches
Copy > Copy as cURL
Paste this cURL in a fileSecurely send this file to Drieam
You can send it using for example 1Password, SURF Filesender, or any other secure file-sharing service.